
作者:同程安全應急響應中心
0x01 故事背景
某一天的早上你懷著愉快的心情來到公司,開始美好的一天工作生活。有個業務后臺的同事找到你說,昨天下班后有人反饋說訪問他的業務后臺有問題,他想分析網絡層面的數據包看看,是否能看出什么問題。你微微一笑,作為一個資深網工,抓包這種小事,這不是正是花式秀 tcpdump 還是 tshark 的時候么?
突然又覺得那里不對…什么鬼,要抓昨天晚上的數據包,你突然想到的竟然是這貨...
既然沒有這么逆天的技能的時光雞小伙伴,那還是搭建一個流量回溯系統吧。
0x02 架構簡述
流量回溯系統首先要面臨幾個問題:數據包的存取和協議的分析,當數據量很大的時候檢索的速度等…
剛開始的想法是使用 tshark 設定數據包大小,讓 tshark 在后臺一直抓包。用了一下效果不忍直視。
后來又找了一些其它的解決方案比如: Analyzing Network Packets with Wireshark, Elasticsearch, and Kibana之類的,效果都不是很好
直到有一天 老大介紹了一個系統 moloch
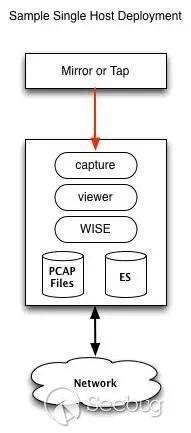
數據的來源是交換機的鏡像端口,moloch 系統主要涉及三個組件 Capture,elasticsearch 和 Viewer Capture 用來抓取 流量會以pcap的格式存儲到硬盤上面,還會存一份對應關系到es中,Viewer提供web界面。
moloch簡介
Moloch是一款由 AOL 開源的,能夠大規模的捕獲IPv4數據包(PCAP)、索引和數據庫系統
環境搭建
存儲數據包對機器的性能要求 moloch 提供了評估頁面
硬件環境:我的測試環境是一臺Dell Inc. PowerEdge R720/0T0WRN
cpu : Intel(R) Xeon(R) CPU E5-2650 0 @ 2.00GHz
memory: 100G+
disk: 8T
這是一臺配置比較好的機器。所以我的Capture Machines和Elasticsearch Machines都放在一臺上面, 有條件的強烈推薦把這2個組件分離開來
根據官方的文檔有2個事情注意一下:
1 Moloch is no longer supported on 32 bit machines.
moloch不支持32位系統
2 Our deployment is on Centos 6 with the elrepo 4.x kernel upgrade for packet performance increases.
內核4.X 有助于抓包性能提升
我的系統環境 centos7 更新到最新的版本
[root@moloch ~]# cat /etc/redhat-release CentOS Linux release 7.4.1708 (Core)內核版本也更新到4.x。
[root@moloch ~]# uname -r4.13.7-1.el7.elrepo.x86_64moloch 安裝
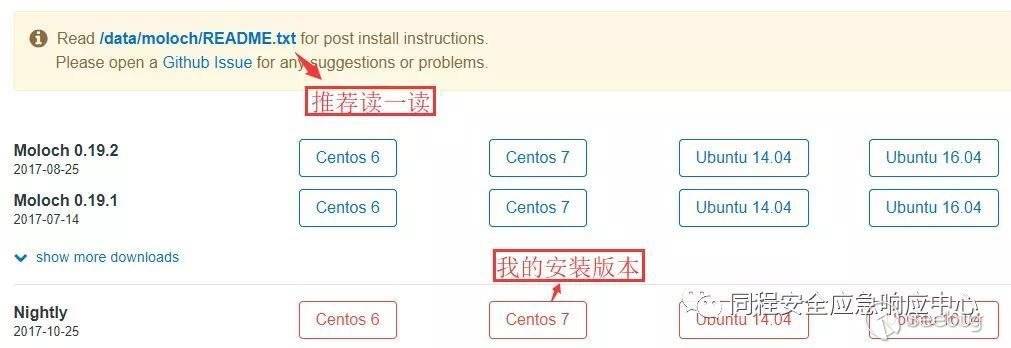
先去官網下載一下安裝包 Downloads
我選擇是Nightly 版本 可以體驗新的特性
moloch安裝命令
rpm -ivh moloch-nightly.x86_64.rpmpfring 安裝
moloch的Capture 默認使用libpcap 后面我們會用pfring 提升抓包性能
?   cd /etc/yum.repos.d/
?   wget http://packages.ntop.org/centos-stable/ntop.repo -O ntop.repo? wget http://packages.ntop.org/centos-stable/epel-7.repo -O epel.repo?   yum erase zeromq3 (Do this once to make sure zeromq3 is not installed)
?   yum clean all
?   yum update
?   yum install pfring
elasticsearch 安裝配置
es可以選擇在配置moloch時候安裝 也可以自己單獨安裝 我選擇自己單獨安裝
安裝命令
rpm -ivh elasticsearch-5.6.2.rpm# 優化es[root@moloch elasticsearch]# vim jvm.options# Xms represents the initial size of total heap space# Xmx represents the maximum size of total heap space-Xms32g-Xmx32g[root@moloch elasticsearch]# vim elasticsearch.yml#抓包經常會把硬盤用完,當硬盤使用空間到80% es 就開始報警 ,我直接把報警關掉的。cluster.routing.allocation.disk.threshold_enabled: falsenetwork.host: 10.10.7.7[root@moloch ~]# curl http://10.10.7.7:9200{ "name" : "E2BtdPC", "cluster_name" : "elasticsearch", "cluster_uuid" : "EiSTiNE-QGaTt9z0V8HPkw", "version" : { "number" : "5.6.2", "build_hash" : "57e20f3", "build_date" : "2017-09-23T13:16:45.703Z", "build_snapshot" : false, "lucene_version" : "6.6.1"
}, "tagline" : "You Know, for Search"}0x03 配置優化
配置moloch
# 開始使用腳本配置moloch[root@moloch db]# /data/moloch-nightly/bin/ConfigureFound interfaces: bond0;em1;em2;em3;em4;lo# 選擇需要監控的網卡 也就是你的鏡像流量對應的網卡Semicolon ';' seperated list of interfaces to monitor [eth1] em4
Install Elasticsearch server locally for demo, must have at least 3G of memory, NOT recommended for prod# 寫上es地址Elasticsearch server URL [http://localhost:9200] http://10.10.7.7:9200
# 輸入一個密碼
Password to encrypt S2S and other things [no-default] 輸密碼
Moloch - Creating configuration files
Installing systemd start files, use systemctl
Moloch - Installing /etc/logrotate.d/moloch to rotate files after 7 days
Moloch - Installing /etc/security/limits.d/99-moloch.conf to make core and memlock unlimited
Moloch - Downloading GEO files# 這個地方等待時間有點長,需要去下載下面的文件2017-09-27 14:56:46 URL:https://www.iana.org/assignments/ipv4-address-space/ipv4-address-space.csv [23062017-09-27 14:57:02 URL:http://www.maxmind.com/download/geoip/database/asnum/GeoIPASNum.dat.gz [2462473/2017-09-27 15:13:14 URL:http://download.maxmind.com/download/geoip/database/asnum/GeoIPASNumv6.dat.gz [22017-09-27 15:13:26 URL:http://www.maxmind.com/download/geoip/database/GeoLiteCountry/GeoIP.dat.gz [65822017-09-27 15:13:35 URL:http://geolite.maxmind.com/download/geoip/database/GeoIPv6.dat.gz [1044601/10446# 5)  Initialize/Upgrade Elasticsearch Moloch configuration[root@moloch db]# /data/moloch/db/db.pl http://10.10.7.7:9200 initIt is STRONGLY recommended that you stop ALL moloch captures and viewers before proceeding.

There is 1 elastic search data node, if you expect more please fix first before proceeding.

This is a fresh Moloch install
Erasing
Creating

Finished.  Have fun!Finished#6) Add an admin user if a new install or after an init[root@moloch db]# /data/moloch/bin/moloch_add_user.sh admin "輸密碼" tcitops --admin

 7) Start everything
[root@moloch db]# systemctl restart molochcapture.service[root@moloch db]# systemctl restart molochviewer.service8) Look at log files for errors
      /data/moloch/logs/viewer.log
      /data/moloch/logs/capture.log9) Visit http://molochhost:8005 with your favorite browser.
      user: admin
      password: password from step #6
不要使用弱口令哦
moloch 登陸
經過上面的配置,讓我們來訪問一下 moloch
在瀏覽器中輸入 http://10.10.7.7:8005 輸入賬號上面定的密碼。
出現如下界面的時候 表示系統已經搭建起來啦。
0x04 數據刪除
我現在的環境每天都有好幾個T的數據包,es每天也有差不多200個G數據產生,所以當系統搭建起來后第一件事情 強烈推薦大家考慮數據的刪除保留問題。
# 關于pcap的數據包 我是使用moloch來控制刪除[root@moloch ~]# vim /data/moloch-nightly/etc/config.ini# moloch 默認是freeSpaceG = 5%,也就是磁盤空間會保留5% freeSpaceG = 5%# es使用moloch自帶的腳本來控制刪除 [root@moloch db]# vim daily.sh #!/bin/sh# This script is only needed for Moloch deployments that monitor live traffic.# It drops the old index and optimizes yesterdays index.# It should be run once a day during non peak time.# CONFIGESHOSTPORT=10.100.10.7:9200
RETAINNUMDAYS=1
/data/moloch-nightly/db/db.pl $ESHOSTPORT expire daily $RETAINNUMDAYS# 在做個定時任務 每天晚上跑一次[root@moloch ~]# crontab -e01 04 * * * /data/moloch-nightly/db/daily.sh >> /var/log/moloch/daily.log 2>&1網卡優化
# Set ring buf size, see max with ethool -g eth0ethtool -G eth0 rx 4096 tx 4096# Turn off feature, see available features with ethtool -k eth0ethtool -K eth0 rx off tx off gs off tso off gso offHigh Performance Settings
# MOST IMPORTANT, use basic magicMode, libfile kills performancemagicMode=basic# 官方說 pfring 效果更好 # pfring/snf might be betterpcapReadMethod=tpacketv3# Increase by 1 if still getting Input Dropstpacketv3NumThreads=2# DefaultspcapWriteMethod=simplepcapWriteSize = 2560000# Start with 5 packet threads, increase by 1 if getting thread dropspacketThreads=5# Set to number of packets a secondmaxPacketsInQueue = 200000pfring 配置
# 什么鬼 官方又建議 先去嘗試tpacketv3  不過我還是建議使用pfring We suggest you try tpacketv3 first if available on the host

[root@moloch ~]# vim /data/moloch-nightly/etc/config.inirootPlugins=reader-pfring.so
pcapReadMethod=pfring
查看抓包
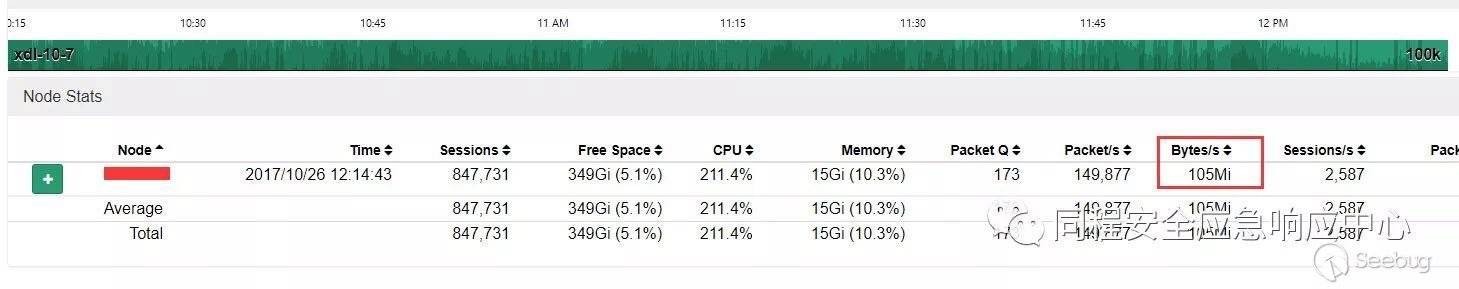
# 讓我們先用命令看看 網卡接收流量
[root@moloch ~]# dstat -n
-net/total-
 recv  send 115M 1761k 112M 1238k 109M  168k 107M 1111k 110M 1695k 111M 1477k 107M 2305k
我們在來看看同一時間moloch中抓包數據量,因為都是動態數值,但是結果如此接近,是不是可以說千兆網卡下已經可以做到100% 數據包抓取 不信你去看pfring 官方文檔
0x05 功能使用
看到這里的同學都應該是真愛了,下面開始滿滿都是福利啦
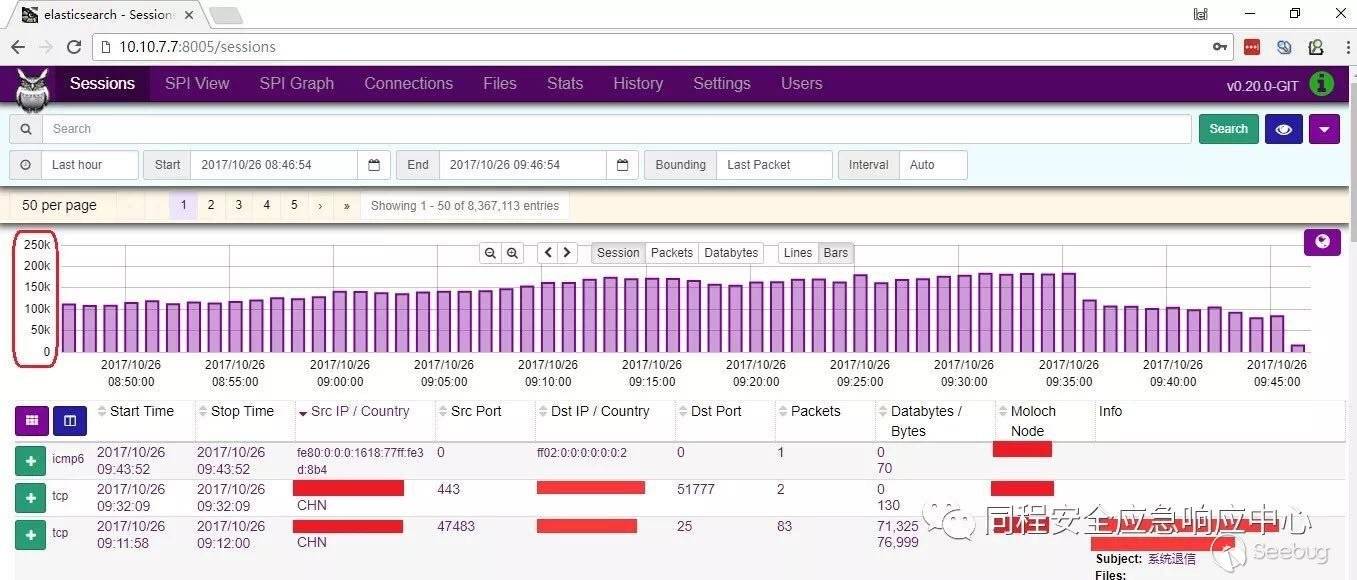
歷史數據分析
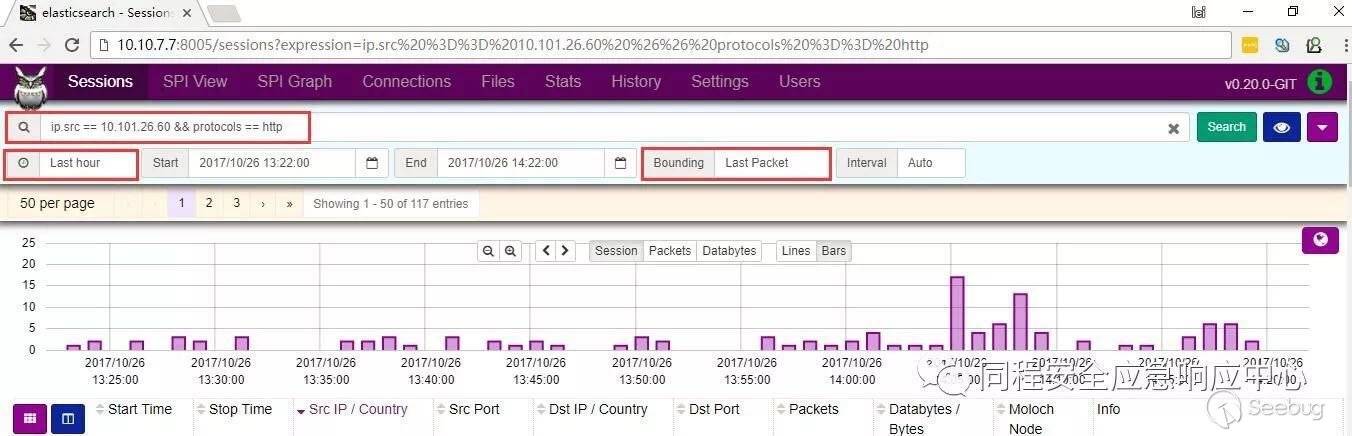
你可以寫一些 search expression 自由搭配檢索你需要的信息,es作為支持速度就是快。
舉個例子: 源ip == 10.101.26.60 and 協議是 http的 信息如下:
數據包導出
你要是更習慣用wireshark分析 ,沒有問題 moloch導出pcap也是很方便的
推薦 time range : “00:00:01” , bounding: “last packet” 。moloch顯示的是會話信息,bounding就很好理解了。
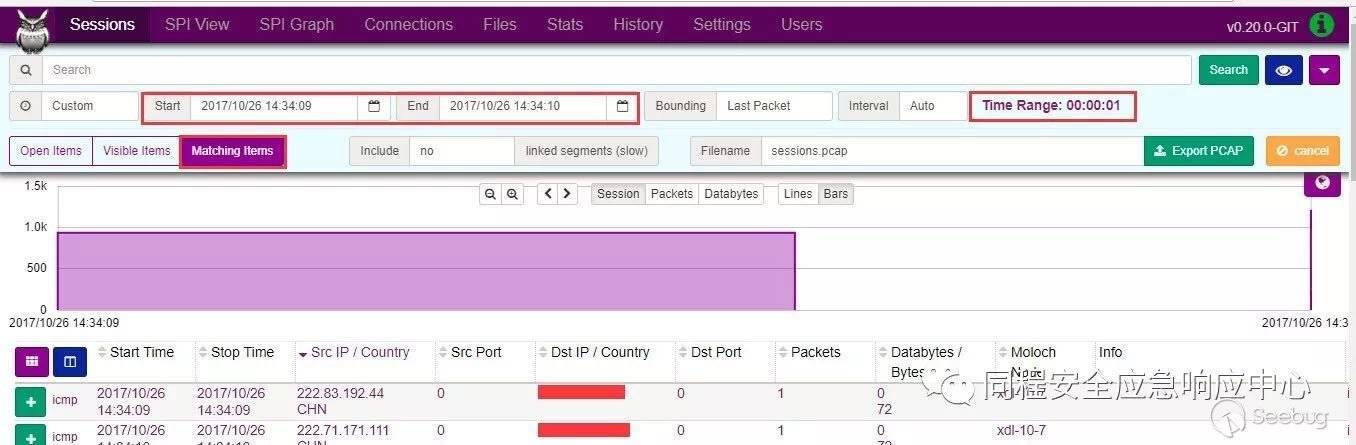
還有記得點一下 “matching items” 我的環境一秒鐘 大概導出200M的數據量。
先確定一下時間 然后點一下 export pcap
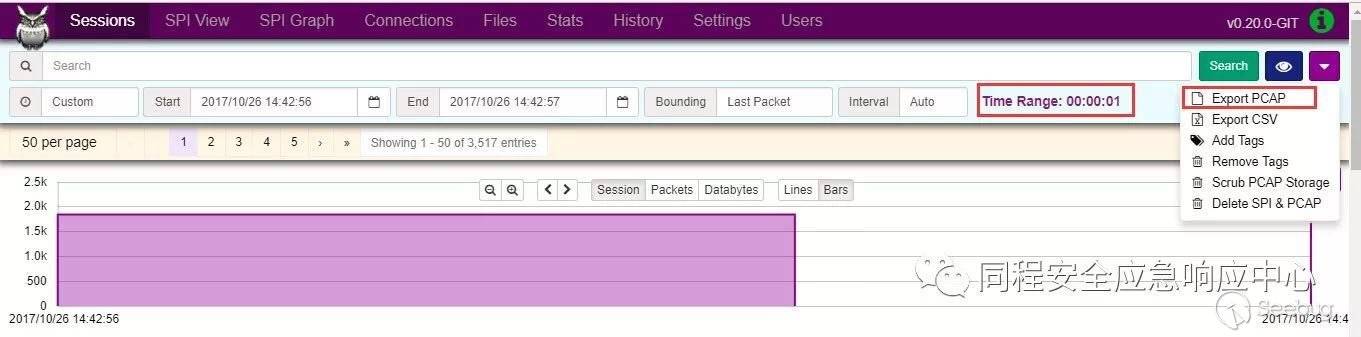
然后開始 export pcap 就這么簡單
0x06 結束語
流量分析是一個比較復雜的系統工作,moloch在大規模的捕獲數據包、索引方面做得相當卓越了。
在數據包的存取問題解決的情況下,隨之而來的更多是數據包的分析:tcp的重傳,mysql的慢查詢,http的響應時間,這些可以從網絡層面給業務帶來紅利的研究 值得大家去深挖研究。
歡迎有興趣的小伙伴留言一起討論。
 本文由 Seebug Paper 發布,如需轉載請注明來源。本文地址:http://www.bjnorthway.com/427/
暫無評論