
作者:RainSec
原文鏈接:https://mp.weixin.qq.com/s/1Ip1Ho4uE_rcywjo3HnH8Q
前言
以經典的GDB為例其項目代碼共有十幾萬行代碼,但是很多情況下只會使用到幾個常用功能:單步,斷點,查看變量,線程/進程切換。而GDB基本上是依賴于ptrace系統調用,主要用于編寫調試程序。大部分實現思路參考Writing a Linux Debugger Part 2: Breakpoints (tartanllama.xyz)系列文章,強烈推薦閱讀
目標功能:
- 單步
- 斷點
- 查看內存/寄存器
- 查看匯編
ptrace 原理
先來看看ptrace系統調用的函數簽名:
#include <sys/ptrace.h>

long ptrace(enum __ptrace_request request, pid_t pid, void *addr, void *data);
/*DESCRIPTION
       The  ptrace()  system  call  provides  a  means  by  which one process (the
       "tracer") may observe and control the execution  of  another  process  (the
       "tracee"), and examine and change the tracee's memory and registers.  It is
       primarily used to implement breakpoint debugging and system call tracing.
       即ptrace系統調用提供給tracer控制,讀取,修改另一個進程(tracee)的能力,由此可以實現斷點和系統調用追蹤

       A tracee first needs to be attached to the tracer.  Attachment  and  subse‐
       quent commands are per thread: in a multithreaded process, every thread can
       be individually attached to a (potentially different) tracer, or  left  not
       attached  and  thus  not debugged.  Therefore, "tracee" always means "(one)
       thread", never "a (possibly multithreaded) process".  Ptrace  commands  are
       always sent to a specific tracee using a call of the form
       即tracer通過ptrace進行附加(attach)和發送命令都是針對某一個線程的而不是進程
*/- request:調試者(tracer)要執行的操作,常見的有PTRACE_TRACEME,PTRACE_ATTACH,PTRACE_PEEKUSER,PTRACE_SINGLESTEP等
- pid:被調試進程(tracee)pid
- addr:要讀寫的內存地址
- data:如果要向目標進程寫入數據那么data就是我們數據地址;如果要讀取目標進程數據那么data就是保留數據的地址
ptrace系統調用會根據不同的request完成不同功能如:
- PTRACE_TRACEME:表示此進程即將被父進程trace,此時其他參數被忽略
- PTRACE_PEEKTEXT, PTRACE_PEEKDATA:讀取tracee在addr(虛擬內存空間)處的一個字,返回值就是讀取到的字
- PTRACE_PEEKUSER:讀取tracee的USER area,其包含了該進程的寄存器以及其他信息
- PTRACE_POKETEXT, PTRACE_POKEDATA:復制data所指向的一個字到tracee的addr(虛擬內存空間)處
- PTRACE_POKEUSER:復制data所指的一個字帶tracee的USER area
- PTRACE_GETREGS, PTRACE_GETFPREGS:復制tracee的
通用寄存器或者浮點寄存器到tracer的data所指的位置,addr被忽略 - PTRACE_SETREGS, PTRACE_SETFPREGS:修改tracee的通用寄存器或者浮點寄存器
- PTRACE_CONT:運行被暫停的tracee進程。如果data參數非0那么就表示data是傳給tracee的信號數值
- PTRACE_SYSCALL, PTRACE_SINGLESTEP:運行被暫停的tracee進程就像PTRACE_CONT功能,不同的是PTRACE_SYSCALL表示運行到下一個系統調用(進入或返回),PTRACE_SINGLESTEP表示僅運行一條指令便停止
以下是Linux-2.4.16內核的ptrace系統調用內部實現源碼:
asmlinkage int sys_ptrace(long request, long pid, long addr, long data)     //asmlinkage是指明該函數用堆棧來傳遞參數
{
    struct task_struct *child;
    struct user * dummy = NULL;
    int i, ret;

    lock_kernel();
    ret = -EPERM;
    if (request == PTRACE_TRACEME) {        /*檢查traced狀態是否重復*/
        /* are we already being traced? */
        if (current->ptrace & PT_PTRACED)
            goto out;
        /* set the ptrace bit in the process flags. */
        current->ptrace |= PT_PTRACED;      //current指向當前進程(task_struct),因此PTRACE_TRACEME將當前進程設置為PT_PTRACED狀態(traced)即被trace者(tracee)
        ret = 0;
        goto out;
    }
    ret = -ESRCH;
    read_lock(&tasklist_lock);              //調度鏈表上讀鎖
    child = find_task_by_pid(pid);          //獲取目標pid進程結構體(task_struct)
    if (child)
        get_task_struct(child);
    read_unlock(&tasklist_lock);
    if (!child)
        goto out;

    ret = -EPERM;
    if (pid == 1)       /* you may not mess with init */
        goto out_tsk;
    /*就像gdb有直接啟動并調試一個程序和附加一個進程并調試兩個功能,也是基于ptrace的PTRACE_ATTACH讓目標進程處于traced狀態*/
    if (request == PTRACE_ATTACH) {
        ret = ptrace_attach(child);
        goto out_tsk;
    }

    ...
    /*這就是ptrace的主體,通過switch case和request完成,這里先了解部分*/
    switch (request) {
    /* when I and D space are separate, these will need to be fixed. */
    /*PTRACE_PEEKTEXT,PTRACE_PEEKDATA功能相同都是從虛擬地址addr中讀取數據到data指針中*/
    case PTRACE_PEEKTEXT: /* read word at location addr. */
    case PTRACE_PEEKDATA: {
        unsigned long tmp;
        int copied;

        copied = access_process_vm(child, addr, &tmp, sizeof(tmp), 0);
        ret = -EIO;
        if (copied != sizeof(tmp))
            break;
        ret = put_user(tmp,(unsigned long *) data);
        break;
    }

    /* read the word at location addr in the USER area. */
    /*可以檢查用戶態內存區域(USER area),從USER區域中讀取一個字節,偏移量為addr*/
    case PTRACE_PEEKUSR: {
        unsigned long tmp;

        ret = -EIO;
        if ((addr & 3) || addr < 0 ||
            addr > sizeof(struct user) - 3)
            break;

        tmp = 0;  /* Default return condition */
        if(addr < FRAME_SIZE*sizeof(long))
            tmp = getreg(child, addr);
        if(addr >= (long) &dummy->u_debugreg[0] &&
           addr <= (long) &dummy->u_debugreg[7]){
            addr -= (long) &dummy->u_debugreg[0];
            addr = addr >> 2;
            tmp = child->thread.debugreg[addr];
        }
        ret = put_user(tmp,(unsigned long *) data);
        break;
    }

    /* when I and D space are separate, this will have to be fixed. */
    /*PTRACE_POKETEXT和PTRACE_POKEDATA功能相同都是向虛擬地址addr寫入來自data的數據*/
    case PTRACE_POKETEXT: /* write the word at location addr. */
    case PTRACE_POKEDATA:
        ret = 0;
        if (access_process_vm(child, addr, &data, sizeof(data), 1) == sizeof(data))
            break;
        ret = -EIO;
        break;

    case PTRACE_POKEUSR: /* write the word at location addr in the USER area */
        ret = -EIO;
        if ((addr & 3) || addr < 0 ||
            addr > sizeof(struct user) - 3)
            break;

        if (addr < FRAME_SIZE*sizeof(long)) {
            ret = putreg(child, addr, data);
            break;
        }
        /* We need to be very careful here.  We implicitly
           want to modify a portion of the task_struct, and we
           have to be selective about what portions we allow someone
           to modify. */

          ret = -EIO;
          if(addr >= (long) &dummy->u_debugreg[0] &&
             addr <= (long) &dummy->u_debugreg[7]){

              if(addr == (long) &dummy->u_debugreg[4]) break;
              if(addr == (long) &dummy->u_debugreg[5]) break;
              if(addr < (long) &dummy->u_debugreg[4] &&
                 ((unsigned long) data) >= TASK_SIZE-3) break;

              if(addr == (long) &dummy->u_debugreg[7]) {
                  data &= ~DR_CONTROL_RESERVED;
                  for(i=0; i<4; i++)
                      if ((0x5f54 >> ((data >> (16 + 4*i)) & 0xf)) & 1)
                          goto out_tsk;
              }

              addr -= (long) &dummy->u_debugreg;
              addr = addr >> 2;
              child->thread.debugreg[addr] = data;
              ret = 0;
          }
          break;
    /*都是讓tracee繼續運行,只是啥時候停止不同*/
    case PTRACE_SYSCALL: /* continue and stop at next (return from) syscall */
    case PTRACE_CONT: { /* restart after signal. */
        long tmp;

        ret = -EIO;
        if ((unsigned long) data > _NSIG)   //data為tracer傳給tracee的信號數值,這里檢查范圍
            break;
        if (request == PTRACE_SYSCALL)
            child->ptrace |= PT_TRACESYS;   //設置PT_TRACESYS標志,為了在下一個系統調用處停止
        else
            child->ptrace &= ~PT_TRACESYS;  //清除PT_TRACESYS標志,不停止
        child->exit_code = data;
    /* make sure the single step bit is not set. 清除EFLAGS的單步標志(Trap Flag)*/
        tmp = get_stack_long(child, EFL_OFFSET) & ~TRAP_FLAG;
        put_stack_long(child, EFL_OFFSET,tmp);
        wake_up_process(child);             //喚醒進程
        ret = 0;
        break;
    }

/*
 * make the child exit.  Best I can do is send it a sigkill.
 * perhaps it should be put in the status that it wants to
 * exit.
 */
    case PTRACE_KILL: {
        long tmp;

        ret = 0;
        if (child->state == TASK_ZOMBIE)    /* already dead */
            break;
        child->exit_code = SIGKILL;
        /* make sure the single step bit is not set. */
        tmp = get_stack_long(child, EFL_OFFSET) & ~TRAP_FLAG;
        put_stack_long(child, EFL_OFFSET, tmp);
        wake_up_process(child);
        break;
    }
    /*設置單步運行很簡單只需將eflags的Trap Flag置1即可*/
    case PTRACE_SINGLESTEP: {  /* set the trap flag. */
        long tmp;

        ret = -EIO;
        if ((unsigned long) data > _NSIG)
            break;
        child->ptrace &= ~PT_TRACESYS;
        if ((child->ptrace & PT_DTRACE) == 0) {
            /* Spurious delayed TF traps may occur */
            child->ptrace |= PT_DTRACE;
        }
        tmp = get_stack_long(child, EFL_OFFSET) | TRAP_FLAG;    //Trap Flag置1
        put_stack_long(child, EFL_OFFSET, tmp);
        child->exit_code = data;
        /* give it a chance to run. */
        wake_up_process(child);
        ret = 0;
        break;
    }

    case PTRACE_DETACH:
        /* detach a process that was attached. */
        ret = ptrace_detach(child, data);
        break;
    /*讀取所有通用寄存器值*/
    case PTRACE_GETREGS: { /* Get all gp regs from the child. */
        if (!access_ok(VERIFY_WRITE, (unsigned *)data, FRAME_SIZE*sizeof(long))) {
            ret = -EIO;
            break;
        }
        for ( i = 0; i < FRAME_SIZE*sizeof(long); i += sizeof(long) ) {
            __put_user(getreg(child, i),(unsigned long *) data);
            data += sizeof(long);
        }
        ret = 0;
        break;
    }
    /*設置所有通用寄存器值*/
    case PTRACE_SETREGS: { /* Set all gp regs in the child. */
        unsigned long tmp;
        if (!access_ok(VERIFY_READ, (unsigned *)data, FRAME_SIZE*sizeof(long))) {
            ret = -EIO;
            break;
        }
        for ( i = 0; i < FRAME_SIZE*sizeof(long); i += sizeof(long) ) {
            __get_user(tmp, (unsigned long *) data);
            putreg(child, i, tmp);
            data += sizeof(long);
        }
        ret = 0;
        break;
    }
    /*獲取浮點寄存器值*/
    case PTRACE_GETFPREGS: { /* Get the child FPU state. */
        if (!access_ok(VERIFY_WRITE, (unsigned *)data,
                   sizeof(struct user_i387_struct))) {
            ret = -EIO;
            break;
        }
        ret = 0;
        if ( !child->used_math ) {
            /* Simulate an empty FPU. */
            set_fpu_cwd(child, 0x037f);
            set_fpu_swd(child, 0x0000);
            set_fpu_twd(child, 0xffff);
        }
        get_fpregs((struct user_i387_struct *)data, child);
        break;
    }
    /*設置浮點寄存器值*/
    case PTRACE_SETFPREGS: { /* Set the child FPU state. */
        if (!access_ok(VERIFY_READ, (unsigned *)data,
                   sizeof(struct user_i387_struct))) {
            ret = -EIO;
            break;
        }
        child->used_math = 1;
        set_fpregs(child, (struct user_i387_struct *)data);
        ret = 0;
        break;
    }

    case PTRACE_GETFPXREGS: { /* Get the child extended FPU state. */
        ...
    }

    case PTRACE_SETFPXREGS: { /* Set the child extended FPU state. */
        ...
    }

    case PTRACE_SETOPTIONS: {
        if (data & PTRACE_O_TRACESYSGOOD)
            child->ptrace |= PT_TRACESYSGOOD;
        else
            child->ptrace &= ~PT_TRACESYSGOOD;
        ret = 0;
        break;
    }

    default:
        ret = -EIO;
        break;
    }
out_tsk:
    free_task_struct(child);
out:
    unlock_kernel();
    return ret;
}注意這個函數get_stack_long(proccess, offset):
/*
 * this routine will get a word off of the processes privileged stack.
 * the offset is how far from the base addr as stored in the TSS.
 * this routine assumes that all the privileged stacks are in our
 * data space.
 */
static inline int get_stack_long(struct task_struct *task, int offset)
{
    unsigned char *stack;

    stack = (unsigned char *)task->thread.esp0;
    stack += offset;
    return (*((int *)stack));
}
其中task->thread.esp0是堆棧指針,通用的寄存器在堆棧中按順序排放,通過偏移量0ffset便可以依次讀取
PTRACE_TRACEME
當要調試一個進程時需要其進入被追蹤狀態(traced),有兩種方法進入該狀態:
- 被調試進程主動調用
ptrace(PTRACE_TRACEME, ...)進入traced狀態 - 調試進程調用
ptrace(PTRACE_ATTACH, pid, ...)來使指定進程進入
總之被調試進程必須進入traced狀態才能進行調試,因為Linux會對處于traced狀態的進程進行特殊操作。以第一種方式來說明:
if (request == PTRACE_TRACEME) {
        /* are we already being traced? */
        if (current->ptrace & PT_PTRACED)
            goto out;
        /* set the ptrace bit in the process flags. */
        current->ptrace |= PT_PTRACED;
        ret = 0;
        goto out;
}只是將當前進程標記為PT_PTRACED狀態,但是如果該進程接下來進行execve系統調用去執行一個外部程序時會暫停當前進程,并且發送SIGCHLD信號給父進程,父進程接收到該信號時就可以對被調試進程進行調試。
sys_execve() -> do_execve() -> load_elf_binary():
static int load_elf_binary(struct linux_binprm * bprm, struct pt_regs * regs)
{
    ...
    if (current->ptrace & PT_PTRACED)
        send_sig(SIGTRAP, current, 0);
    ...
}對于處于traced狀態的進程執行execve系統調用時會發送一個SIGTRAP給當前進程。這個信號將在do_signal函數處理:
int do_signal(struct pt_regs *regs, sigset_t *oldset)
{
for (;;) {
unsigned long signr;
spin_lock_irq(¤t->sigmask_lock);
signr = dequeue_signal(¤t->blocked, &info);
spin_unlock_irq(¤t->sigmask_lock);
// 如果進程被標記為 PTRACE 狀態
if ((current->ptrace & PT_PTRACED) && signr != SIGKILL) { //除了SIGKILL信號,都將讓tracee停止并通知tracer
/* 讓調試器運行 */
current->exit_code = signr;
current->state = TASK_STOPPED; // 讓自己進入停止運行狀態
notify_parent(current, SIGCHLD); // 發送 SIGCHLD 信號給父進程表示子進程"死亡(被替換)"
schedule(); // 讓出CPU的執行權限
...
}
}
}所以調試器使用這種方式調試某個程序時大致例程為:

當父進程(調試進程)接收到 SIGCHLD 信號后,表示被調試進程已經標記為被追蹤狀態并且停止運行,那么調試進程就可以開始進行調試了。
PTRACE_SINGLESTEP
單步運行是最為常用的,當把tracee設置為單步運行模式時,tracee每執行一條指令CPU都會停止然后向父進程發送一個SIGCHLD信號,在ptrace中實現是將eflags設置trap_flag標志位:
case PTRACE_SINGLESTEP: {  /* set the trap flag. */
        long tmp;

        ret = -EIO;
        if ((unsigned long) data > _NSIG)
            break;
        child->ptrace &= ~PT_TRACESYS;
        if ((child->ptrace & PT_DTRACE) == 0) {
            /* Spurious delayed TF traps may occur */
            child->ptrace |= PT_DTRACE;
        }
        tmp = get_stack_long(child, EFL_OFFSET) | TRAP_FLAG;
        put_stack_long(child, EFL_OFFSET, tmp);
        child->exit_code = data;
        /* give it a chance to run. */
        wake_up_process(child);
        ret = 0;
        break;
    }
能夠這樣做是基于X86 intel CPU提供一個硬件機制,就是當eflags的Trap Flag置為1時,CPU每執行一條指令都會產生一個異常然后Linux異常處理機制進程處理,由此會發送一個SIGTRAP信號給tracee;核心是:
tmp = get_stack_long(child, EFL_OFFSET) | TRAP_FLAG;
put_stack_long(child, EFL_OFFSET, tmp);- 獲取進程的
eflags寄存器的值,并且設置Trap Flag標志。 - 把新的值設置到進程的
eflags寄存器中。
設置完寄存器后喚醒(wake_up_process)進程,讓其進入運行狀態:
同樣的當tracee執行完一條指令獲取SIGTRAP信號,在do_signal函數處理信號時,由于current->ptrace & PT_PTRACED將停止執行并發送SIGCHLD信號給父進程tracer。父進程接收到SIGCHLD信號后就知道tracee停止,可以發送命令來讀取或者修改tracee的內存數據或寄存器,或者通過調用 ptrace(PTRACE_CONT, child,...) 來讓被調試進程進行運行等
Debugger 基本功能實現
實現一個簡單的debugger,大致模型如下:主程序fork一個子程序去執行待調試程序;然后主程序循環等待用戶輸入命令,停止主程序停止并等待輸入命令的條件就是子程序停止,這會在首次execute一個程序發生,以及單步(PTRACE_SINGLESTEP)或者斷點發生。子程序很簡單只需要調用execute系統調用啟動一個新程序即可
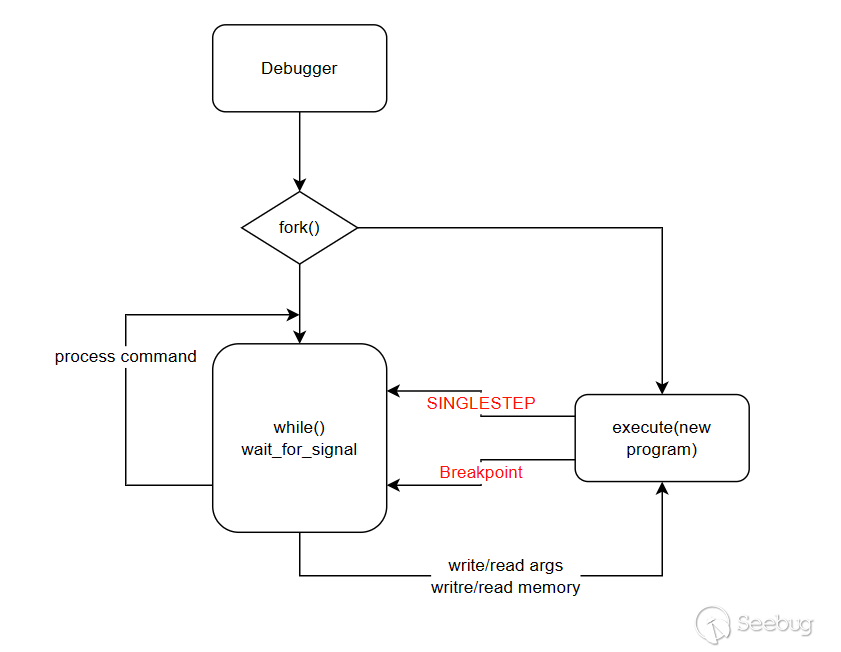
待實現的debugger有三個基本功能:單步,讀寫寄存器,讀寫內存。基于這三個功能再添加其他類似于gdb的功能。初始框架如下:
int main(int argc, char *argv[]){
    if(argc < 2){
        fprintf(stderr, "Expecting program name.\n");
        return -1;
    }

    const char *name = argv[1];
    pid_t pid = fork();
    if(pid == 0){
        //child process
        //execute tracee
        ptrace(PTRACE_TRACEME, 0, 0, 0);
        execl(name, name, NULL, NULL);
    }else if(pid > 0){
        //parent process
        //execute tracer
    }else{
        perror("fork.");
        return -1;
    }

    return 0;
}
子程序部分很簡單調用exec族函數即可。
Parent
首先考慮使用一個結構體記錄子進程的信息,然后父進程進入一個讀取用戶命令的循環,這里使用linenoise開源項目實現命令補全,命令記錄等功能當然還需要處理命令:
/**
 * debugger uitls
*/
typedef struct Debugger{
    const char *d_name;
    int d_pid;
    Breakpoint *d_brks;         //記錄斷點
}Debugger;
void dbg_run(Debugger *dbg){
    int wait_status;
    char *cmd;
    waitpid(dbg->d_pid, &wait_status, 0);
    /*UI for start up*/
    while((cmd = linenoise("minidbg$ ")) != NULL){
        dbg_handle_command(dbg, cmd);
        linenoiseHistoryAdd(cmd);
        linenoiseFree(cmd);
    }
}使用Debugger結構體記錄程序狀態,主要是子程序pid和之后的斷點信息;linenoise("minidbg$ ")會打印minidbg$并等待輸入,使用dbg_handle_command處理命令包括讀寫內存,寄存器,下斷點等。linenoiseHistoryAdd(cmd)將命令添加到歷史記錄中
在dbg_handle_command函數中大致結構為:很方便添加新功能,is_prefix輔助函數用于判斷縮寫指令
void dbg_handle_command(Debugger *dbg, char *cmd){
    char *lcmd = strdup(cmd);
    char *argv[8] = { 0 };
    char *command;

    argv[0] = strtok(lcmd, " ");
    for(int i = 1; i < 8; i++){
        argv[i] = strtok(NULL, " ");
        if(argv[i] == NULL) break;
    }
    command = argv[0];
    if(command == NULL) return;
    if(is_prefix(command, "continue")){
        /*do_command*/
    }
    else{
        fprintf(stderr, "Unkown command: %s.\n", command);
    }

    return free(lcmd);
}

bool is_prefix(char *s, const char *ss){
    if(s == NULL || ss == NULL) return false;
    if(strlen(s) > strlen(ss)) return false;

    return !strncmp(s, ss, strlen(s));
}
讀寫寄存器
一個非常基礎的功能,基于ptrace(PTRACE_GETREGS, ...)和ptrace(PTRACE_SETREGS, ...)讀寫寄存器,為了保留寄存器信息在**<sys/user.h>**頭文件中定義了如下結構體:
struct user_regs_struct
{
  __extension__ unsigned long long int r15;
  __extension__ unsigned long long int r14;
  __extension__ unsigned long long int r13;
  __extension__ unsigned long long int r12;
  __extension__ unsigned long long int rbp;
  __extension__ unsigned long long int rbx;
  __extension__ unsigned long long int r11;
  __extension__ unsigned long long int r10;
  __extension__ unsigned long long int r9;
  __extension__ unsigned long long int r8;
  __extension__ unsigned long long int rax;
  __extension__ unsigned long long int rcx;
  __extension__ unsigned long long int rdx;
  __extension__ unsigned long long int rsi;
  __extension__ unsigned long long int rdi;
  __extension__ unsigned long long int orig_rax;
  __extension__ unsigned long long int rip;
  __extension__ unsigned long long int cs;
  __extension__ unsigned long long int eflags;
  __extension__ unsigned long long int rsp;
  __extension__ unsigned long long int ss;
  __extension__ unsigned long long int fs_base;
  __extension__ unsigned long long int gs_base;
  __extension__ unsigned long long int ds;
  __extension__ unsigned long long int es;
  __extension__ unsigned long long int fs;
  __extension__ unsigned long long int gs;
};
配合ptrace可以直接按照以上結構體讀寫寄存器,所以一次讀寫至少是所有通用寄存器。根據結構體排序定義了如下數據結構體來記錄寄存器信息:
/*utils.h*/
enum reg{
    en_rax, en_rbx, en_rcx, en_rdx,
    en_rdi, en_rsi, en_rbp, en_rsp,
    en_r8,  en_r9,  en_r10, en_r11,
    en_r12, en_r13, en_r14, en_r15,
    en_rip, en_rflags,    en_cs,
    en_orig_rax, en_fs_base,
    en_gs_base,
    en_fs, en_gs, en_ss, en_ds, en_es
};

struct reg_descriptor {
    enum reg r;
    char *name;
};
/*utils.c*/
const size_t n_regs = 27;
const struct reg_descriptor g_register_descriptors[] = {
    { en_r15, "r15" },
    { en_r14, "r14" },
    { en_r13, "r13" },
    { en_r12, "r12" },
    { en_rbp, "rbp" },
    { en_rbx, "rbx" },
    { en_r11, "r11" },
    { en_r10, "r10" },
    { en_r9, "r9" },
    { en_r8, "r8" },
    { en_rax, "rax" },
    { en_rcx, "rcx" },
    { en_rdx, "rdx" },
    { en_rsi, "rsi" },
    { en_rdi, "rdi" },
    { en_orig_rax, "orig_rax" },
    { en_rip, "rip" },
    { en_cs, "cs" },
    { en_rflags, "eflags" },
    { en_rsp, "rsp" },
    { en_ss, "ss" },
    { en_fs_base, "fs_base" },
    { en_gs_base, "gs_base" },
    { en_ds, "ds" },
    { en_es, "es" },
    { en_fs, "fs" },
    { en_gs, "gs" }
};因為只能一次讀寫所有寄存器,因此要讀寫某個寄存器時先用ptrace把所有的讀取出來在通過寄存器表查找g_register_descriptors,并且因為寄存器表和struct user_regs_struct結構體排序一致可以直接用表中的偏移讀寫結構體:
void set_register_value(pid_t pid, enum reg r, uint64_t value){
struct user_regs_struct regs;
int reg_descriptor_idx;
ptrace(PTRACE_GETREGS, pid, NULL, ®s);
/*locate reg_r`s index in user_regs_struct struct*/
reg_descriptor_idx = -1;
for(int i = 0; i < n_regs; i++){
if(g_register_descriptors[i].r == r){
reg_descriptor_idx = i;
break;
}
}
*(uint64_t *)((uint64_t *)®s + reg_descriptor_idx) = value;
ptrace(PTRACE_SETREGS, pid, NULL, ®s);
}
uint64_t get_register_value(pid_t pid, enum reg r){
struct user_regs_struct regs;
int reg_descriptor_idx;
uint64_t ret = 0;
ptrace(PTRACE_GETREGS, pid, NULL, ®s);
/*locate reg_r`s index in user_regs_struct struct*/
reg_descriptor_idx = -1;
for(int i = 0; i < n_regs; i++){
if(g_register_descriptors[i].r == r){
reg_descriptor_idx = i;
break;
}
}
if(reg_descriptor_idx != -1){
ret = *(uint64_t *)((uint64_t *)®s + reg_descriptor_idx);
return ret;
}
printf("[error] get_register_value(%d, %d)\n", pid, r);
return ret;
}
/*輔助函數*/
char *get_register_name(enum reg r){
for(int i = 0; i < n_regs; i++){
if(g_register_descriptors[i].r == r)
return g_register_descriptors[i].name;
}
return NULL;
}
enum reg get_register_from_name(char *name){
for(int i = 0; i < n_regs; i++){
if(!strcasecmp(name, g_register_descriptors[i].name)){
return g_register_descriptors[i].r;
}
}
return -1; /*-1 is impossible in reg_descriptor->r*/
}讀寫內存
讀寫內存和寄存器很類似,但使用ptrace一次性只能讀寫8字節(64位):ptrace(PTRACE_PEEKDATA, dbg->d_pid, address, NULL)需要提供子進程的虛擬內存地址(address)
uint64_t dbg_read_memory(Debugger *dbg, uint64_t address){
    return ptrace(PTRACE_PEEKDATA, dbg->d_pid, address, NULL);
}

void dbg_write_memory(Debugger *dbg, uint64_t address, uint64_t value){
    ptrace(PTRACE_POKEDATA, dbg->d_pid, address, value);
}
斷點
斷點其實有兩種:硬斷點和軟斷點。其中硬斷點涉及到CPU架構數量有限比如x86結構提供4個硬件斷點(斷點寄存器),但可以檢測讀寫執行三種情況。而軟斷點通過在指定位置插入斷點指令,然后程序運行到此處執行斷點指令讓debugger獲取SIGTRAP信號并停止運行,因此軟斷點可以有無數個;這里主要實現軟斷點,如x86的斷點指令為int 3(機器碼 0xcc),需要考慮斷點插入,斷點記錄,觸發斷點后如何繼續運行等
使用如下結構體存儲斷點信息:
/**
 * breakpoints utils
*/
typedef struct Breakpoint{
    int b_pid;
    unsigned long b_addr;           //map key
    int b_enabled;
    unsigned char b_saved_data;     //需要保存插入0xcc位置的數據
    UT_hash_handle hh;
}Breakpoint;借助uthash開源項目實現一個hash表來記錄斷點信息,只需在結構體中包含UT_hash_handle成員即可;其提供宏HASH_FIND_PTR:
#define HASH_FIND_PTR(head,findptr,out) HASH_FIND(hh,head,findptr,sizeof(void *),out)可以通過結構體中的b_addr作為key,其表頭在初始化Debugger結構體時設置為NULL即可:
Debugger dbg;
dbg.d_brks = NULL;       /* important! initialize to NULL related to breakpoints` map*/
然后實現兩個斷點函數:brk_enable,brk_disable;分別進行插入斷點和去除斷點:
#include "utils.h"

void brk_enable(Breakpoint *bp){
    unsigned long data = ptrace(PTRACE_PEEKDATA, bp->b_pid, bp->b_addr, 0);
    bp->b_saved_data = data & 0xff;     //save LSB
    data = ((data & ~0xff) | INT3);
    ptrace(PTRACE_POKEDATA, bp->b_pid, bp->b_addr, data);
    bp->b_enabled = 1;
}

void brk_disable(Breakpoint *bp){
    unsigned long data = ptrace(PTRACE_PEEKDATA, bp->b_pid, bp->b_addr, 0);
    data = ((data & ~0xff) | bp->b_saved_data);
    ptrace(PTRACE_POKEDATA, bp->b_pid, bp->b_addr, data);
    bp->b_enabled = 0;
}
單步
單步運行時除了普通指令,需要考慮是否跳過函數調用(call)也就是需要步過的情況,還有如果當前為斷點處單步時需要格外的斷點處理。基于ptrace(PTRACE_SINGLESTEP, ...)單步步入時需要考慮兩種情況,涉及斷點;其他非斷點情況直接PTRACE_SINGLESTEP單步運行即可
- pc剛好觸發一個斷點,即執行了
0xcc - pc即將觸發一個斷點
使用如下函數處理單步命令:
/*we can show UI here*/
void dbg_step_in(Debugger *dbg){
    uint64_t possible_pc = get_pc(dbg) - 1;    /*if this is breakpoint int 3 executed*/
    Breakpoint *bp = NULL;
    HASH_FIND_PTR(dbg->d_brks, &possible_pc, bp);
    if(bp != NULL && bp->b_enabled){
        /*step over breakpoint*/
        brk_disable(bp);
        set_pc(dbg, possible_pc);
        ptrace(PTRACE_SINGLESTEP, dbg->d_pid, NULL, NULL);
        wait_for_signal(dbg);
        brk_enable(bp);
    }else{
        ptrace(PTRACE_SINGLESTEP, dbg->d_pid, NULL, NULL);
        wait_for_signal(dbg);
    }

    show_UI(dbg);
}
但是后來發現一個bug:當斷點設置在一個單機器碼的指令處時(如 push rbp 0x55),以上邏輯會陷入死循環,因為每次單步時都會檢測pc-1是否為斷點;所以得想辦法面對單機器碼斷點的情況避免該邏輯,不可能把所有單機器碼指令全列出來然后比對,所以這里使用反編譯引擎capstone。如果pc-1是個斷點那么先判斷pc-1處的指令長度是否為1,如果是那么設置一個靜態flag表示已經步過一個單機器碼的斷點下一次單步時不再考慮pc-1:
/**
 * This function invoked in situation:
 * 1.PTRACE_SINGLESTEP the current instruction which maybe inserted a breakpoint OR maybe not
 * 2.already triggered a breakpoint(0xcc) PTRACE_SINGLESTEP the broken instruction
 * we can show UI here
*/
void dbg_step_in(Debugger *dbg){
    static bool one_machine_code_flag = false;
    uint64_t possible_pc, data;
    Breakpoint *bp = NULL;
    csh handle = 0;
    cs_insn* insn;
    size_t count;
    int child_status;

    if(!one_machine_code_flag){
        possible_pc = get_pc(dbg) - 1;          /*if this is breakpoint int 3 executed*/
        HASH_FIND_PTR(dbg->d_brks, &possible_pc, bp);
        if(bp != NULL && bp->b_enabled){
            brk_disable(bp);
            /*check for single machine code instruction*/
            data = ptrace(PTRACE_PEEKDATA, dbg->d_pid, possible_pc, NULL);
            if (cs_open(CS_ARCH_X86, CS_MODE_64, &handle)) {
                printf("[error]: Failed to initialize capstone engine!\n");
                exit(-1);
            }
            cs_disasm(handle, (unsigned char*)&data, 8, 0x1000, 1, &insn);
            if(insn->size == 1){
                one_machine_code_flag = true;
            }else{
                one_machine_code_flag = false;
            }
            set_pc(dbg, possible_pc);
            ptrace(PTRACE_SINGLESTEP, dbg->d_pid, NULL, NULL);
            wait_for_signal(dbg);
            brk_enable(bp);
        }else{
            /*if we are here then this`s caused by PTRACE_SINGLESTEP and maybe we going to trigger a breakpoint or maybe not*/
            possible_pc += 1;
            one_machine_code_flag = false;
            HASH_FIND_PTR(dbg->d_brks, &possible_pc, bp);
            if(bp != NULL && bp->b_enabled){
                brk_disable(bp);
                ptrace(PTRACE_SINGLESTEP, dbg->d_pid, NULL, NULL);
                wait_for_signal(dbg);
                brk_enable(bp);
            }else{
                ptrace(PTRACE_SINGLESTEP, dbg->d_pid, NULL, NULL);
                wait_for_signal(dbg);
            }
        }
    }else{
        /*the previous instruction is a single machine code instruction and breakpoint*/
        possible_pc = get_pc(dbg);      /*check current pc*/
        one_machine_code_flag = false;
        HASH_FIND_PTR(dbg->d_brks, &possible_pc, bp);
        if(bp != NULL && bp->b_enabled){
            brk_disable(bp);
            ptrace(PTRACE_SINGLESTEP, dbg->d_pid, NULL, NULL);
            wait_for_signal(dbg);
            brk_enable(bp);
        }else{
            ptrace(PTRACE_SINGLESTEP, dbg->d_pid, NULL, NULL);
            wait_for_signal(dbg);
        }

    }
    show_UI(dbg);
}
步過主要用在函數調用上,在使用步過時主要考慮以下幾種情況:
- pc觸發了需要步過的call指令上的斷點,即pc執行了0xcc
- pc即將步過的call指令上被插入了斷點
- 其他就是單步情況
這里步過一個call采用的方式是在call指令下一條指令下斷點然后PTRACE_CONT。同樣使用capstone計算call指令長度然后斷下后面一條指令,這樣需要考慮如果被step over的函數如果沒有中斷那么將觸發call指令后面一條指令,那么INT3被執行還需讓pc-1
/**
 * This function invoked in 4 situation:
 * 1.Just work as step in
 * 2.jump over a call but has triggered an breakpoint(0xcc)
 * 3.jump over a call but no breakpoint in current call instruction
 * 4.jump over a call but there is 0xcc in current call instruction
 * we can show UI here
*/
void dbg_step_over(Debugger *dbg){
    uint64_t possible_pc_prev = get_pc(dbg) - 1;        /*if this is breakpoint int 3 executed*/
    uint64_t possible_pc_currn = possible_pc_prev + 1;   /*if current instruction is breakpoint*/
    Breakpoint *bp_prev = NULL;
    Breakpoint *bp_currn = NULL;
    uint64_t data;
    uint64_t next_addr;

    /*Maybe stoped for triggered a breakpoint*/
    /*previous instruction. Jump over a call but has triggered an breakpoint(0xcc)*/
    HASH_FIND_PTR(dbg->d_brks, &possible_pc_prev, bp_prev);
    if(bp_prev != NULL && bp_prev->b_enabled && bp_prev->b_saved_data == 0xE8){     /*call`s op code is 0xE8*/
        /*call instruction has been triggered*/
        brk_disable(bp_prev);
        data = ptrace(PTRACE_PEEKDATA, dbg->d_pid, possible_pc_prev, NULL);
        csh handle = 0;
        cs_insn* insn;
        size_t count;
        int child_status;
        if (cs_open(CS_ARCH_X86, CS_MODE_64, &handle)) {
            printf("[error]: Failed to initialize capstone engine!\n");
            exit(-1);
        }
        cs_disasm(handle, (unsigned char*)&data, 8, possible_pc_prev, 1, &insn);
        next_addr = possible_pc_prev + insn->size;
        dbg_set_breakpoint_at_address(dbg, next_addr);
        set_pc(dbg, possible_pc_prev);
        continue_execution(dbg);                        /*Probably trigger another breakpoint in the function. So we need to disable it when stop*/
        brk_enable(bp_prev);

        HASH_FIND_PTR(dbg->d_brks, &next_addr, bp_prev);
        if(bp_prev != NULL && bp_prev->b_enabled){
            brk_disable(bp_prev);                       /*disable it*/
        }
        if((get_pc(dbg) - 1) == next_addr){             /*we stoped maybe because of triggering int3 below the call. So after continue we should check executed int3*/
            set_pc(dbg, next_addr);
        }
        cs_free(insn, 1);
        cs_close(&handle);
        return;
    }else if(bp_prev != NULL && bp_prev->b_enabled && bp_prev->b_saved_data != 0xE8){
        /*normal instruction has been triggered. Just work as step in*/
        dbg_step_in(dbg);
        return;
    }

    /*stoped for PTRACE_SINGLESTEP*/
    /*current instruction. Jump over a call but there is 0xcc in current call instruction*/
    HASH_FIND_PTR(dbg->d_brks, &possible_pc_currn, bp_currn);
    if(bp_currn != NULL && bp_currn->b_enabled && bp_currn->b_saved_data == 0xE8){
        /*current instruction is breakpoint and it`s a function invoking*/
        brk_disable(bp_currn);
        data = ptrace(PTRACE_PEEKDATA, dbg->d_pid, possible_pc_currn, NULL);
        csh handle = 0;
        cs_insn* insn;
        size_t count;
        int child_status;
        if (cs_open(CS_ARCH_X86, CS_MODE_64, &handle)) {
            printf("[error]: Failed to initialize capstone engine!\n");
            exit(-1);
        }
        cs_disasm(handle, (unsigned char*)&data, 8, possible_pc_currn, 1, &insn);
        next_addr = possible_pc_currn + insn->size;
        dbg_set_breakpoint_at_address(dbg, next_addr);
        continue_execution(dbg);                        /*Probably trigger another breakpoint in the function. So we need to disable it when stop*/
        brk_enable(bp_currn);
        HASH_FIND_PTR(dbg->d_brks, &next_addr, bp_currn);
        if(bp_currn != NULL && bp_currn->b_enabled){
            brk_disable(bp_currn);                      /*disable it*/
        }
        if((get_pc(dbg) - 1) == next_addr){             /*we stoped maybe because of triggering int3 below the call. So after continue we should check executed int3*/
            set_pc(dbg, next_addr);
        }
        cs_free(insn, 1);
        cs_close(&handle);
        return;
    }else if(bp_currn != NULL && bp_currn->b_enabled && bp_currn->b_saved_data != 0xE8){
        /*current instruction is a breakpoint but not a calling so we could just step over. Just work as step in */
        dbg_step_in(dbg);
        show_UI(dbg);
        return;
    }


    /*not breakpoint in current invoking OR current normal instruction*/
    data = ptrace(PTRACE_PEEKDATA, dbg->d_pid, possible_pc_currn, NULL);
    if((data & 0xff) == 0xE8){
        /*Current instruction is a call.Set breakpoint at next instruction then continue*/
        csh handle = 0;
        cs_insn* insn;
        size_t count;
        int child_status;
        if (cs_open(CS_ARCH_X86, CS_MODE_64, &handle)) {
            printf("[error]: Failed to initialize capstone engine!\n");
            exit(-1);
        }
        cs_disasm(handle, (unsigned char*)&data, 8, possible_pc_currn, 1, &insn);
        next_addr = possible_pc_currn + insn->size;
        dbg_set_breakpoint_at_address(dbg, next_addr);
        continue_execution(dbg);
        HASH_FIND_PTR(dbg->d_brks, &next_addr, bp_currn);
        if(bp_currn != NULL && bp_currn->b_enabled){
            brk_disable(bp_currn);
        }
        if((get_pc(dbg) - 1) == next_addr){             /*we stoped maybe because of triggering int3 below the call. So after continue we should check executed int3*/
            set_pc(dbg, next_addr);
        }
        cs_free(insn, 1);
        cs_close(&handle);
        return;
    }else
        dbg_step_in(dbg);           /*Current instruction is normal. Just work as step in*/
}到這里已經具備基本功能了,可以在dbg_handle_command中添加命令支持:
void dbg_handle_command(Debugger *dbg, char *cmd){
    char *lcmd = strdup(cmd);
    char *argv[8] = { 0 };
    char *command;

    argv[0] = strtok(lcmd, " ");
    for(int i = 1; i < 8; i++){
        argv[i] = strtok(NULL, " ");
        if(argv[i] == NULL) break;
    }
    command = argv[0];
    if(command == NULL) return;
    if(is_prefix(command, "continue")){
        continue_execution(dbg);
    }else if(is_prefix(command, "quit")){
        exit_debugger(dbg);
    }else if(is_prefix(command, "break")){      /*format: break/b [addr]*/
        if(argv[1] == NULL)
            puts("command break expect an address!");
        else{
            dbg_set_breakpoint_at_address(dbg, strtoul(argv[1], NULL, 16));
        }
    }else if(is_prefix(command, "register")){   /*format: reg/r dump OR reg/r read/write [reg] value(hex)*/
        if(is_prefix(argv[1], "dump"))
            dbg_dump_all_regs(dbg);
        else if(is_prefix(argv[1], "read")){
            printf("value:\t0x%08lx\n", get_register_value(dbg->d_pid, get_register_from_name(argv[2])));
        }else if(is_prefix(argv[1], "write")){
            set_register_value(dbg->d_pid, get_register_from_name(argv[2]), strtoul(argv[3], NULL, 16));
        }
    }else if(is_prefix(command, "memory")){     /*memory/m read [addr] OR write [addr] [value]*/
        if(is_prefix(argv[1], "read")){
            printf("value:\t0x%08lx\n", dbg_read_memory(dbg, strtoul(argv[2], NULL, 16)));
        }
        else if(is_prefix(argv[1], "write")){
            printf("0x%08lx\t->\t", dbg_read_memory(dbg, strtoul(argv[2], NULL, 16)));
            dbg_write_memory(dbg, strtoul(argv[2], NULL, 16), strtoul(argv[3], NULL, 16));
            printf("0x%08lx\n", dbg_read_memory(dbg, strtoul(argv[3], NULL, 16)));
        }
    }else if(is_prefix(command, "step")){       /*step in OR step over*/
        if(is_prefix(argv[1], "in")){
            dbg_step_in(dbg);
        }else if(is_prefix(argv[1], "over")){
            dbg_step_over(dbg);
        }else{
            puts("Usage: step in / step over");
        }
    }
    else{
        fprintf(stderr, "Unkown command: %s.\n", command);
    }

    return free(lcmd);
}
這些是目前完成的功能,還有進程和線程支持還未完成
匯編
一般debugger是要支持顯示匯編的,這里實現的只是在每次單步和觸發斷點時打印寄存器信息和匯編。可以在每次單步或者觸發斷點時讀取當前pc處的機器碼借助capstone反匯編,但需要注意的是對于x86_64架構最長匯編指令為15字節但很少出現比較長的指令,所以實現匯編打印的時候每次僅讀取16個字節進行反匯編并打印指令
/**
 * consider of the longest instruction is 15bytes(x86_64) then we read 16bytes everytime
 * and disassemble it with capstone engine
 * befor invoking show_asm the caller should make sure current pc is not a breakpoint
*/
void show_asm(Debugger *dbg){
    csh handle;
    cs_insn *insn;
    size_t count;
    uint8_t *code;
    size_t size = 15;
    uint64_t address;

    if(cs_open(CS_ARCH_X86, CS_MODE_64, &handle)){
        printf("[error] cs_open(%d, %d, 0x%08lx)\n", CS_ARCH_X86, CS_MODE_64, &handle);
        exit(-1);
    }
    code = calloc(1, 16);
    address = get_pc(dbg);
    *(uint64_t *)code = ptrace(PTRACE_PEEKDATA, dbg->d_pid, address, NULL);
    *((uint64_t *)code + 1) = ptrace(PTRACE_PEEKDATA, dbg->d_pid, address + 8, NULL);

    /*before we show assembly after pc we should consider if there is breakpoint in machine code behind*/
    Breakpoint *bp = NULL;
    for(uint64_t i = 0, tmp = address; i < size; i++){
        HASH_FIND_PTR(dbg->d_brks, &tmp, bp);
        if(bp != NULL && bp->b_enabled){
            *((uint8_t *)code + i) = bp->b_saved_data;
        }
        tmp++;
    }

    puts("-------------------------[Assembly]-------------------------");
    insn = cs_malloc(handle);
    while(cs_disasm_iter(handle, (const uint8_t **)&code, &size, &address, insn)){
        if(size + insn->size == 15)
            printf("\e[96m0x%08lx:\t%s\t%s\t<======RIP\e[0m\n", insn->address, insn->mnemonic, insn->op_str);
        else
            printf("0x%08lx:\t%s\t%s\n", insn->address, insn->mnemonic, insn->op_str);
    }
    cs_free(insn, 1);
    cs_close(&handle);
}還有就是如果讀取的15個字節中有斷點(0xcc)那么反匯編結果是不準確的,因此先遍歷是否存在斷點并resotre原來的數據再進行反匯編。
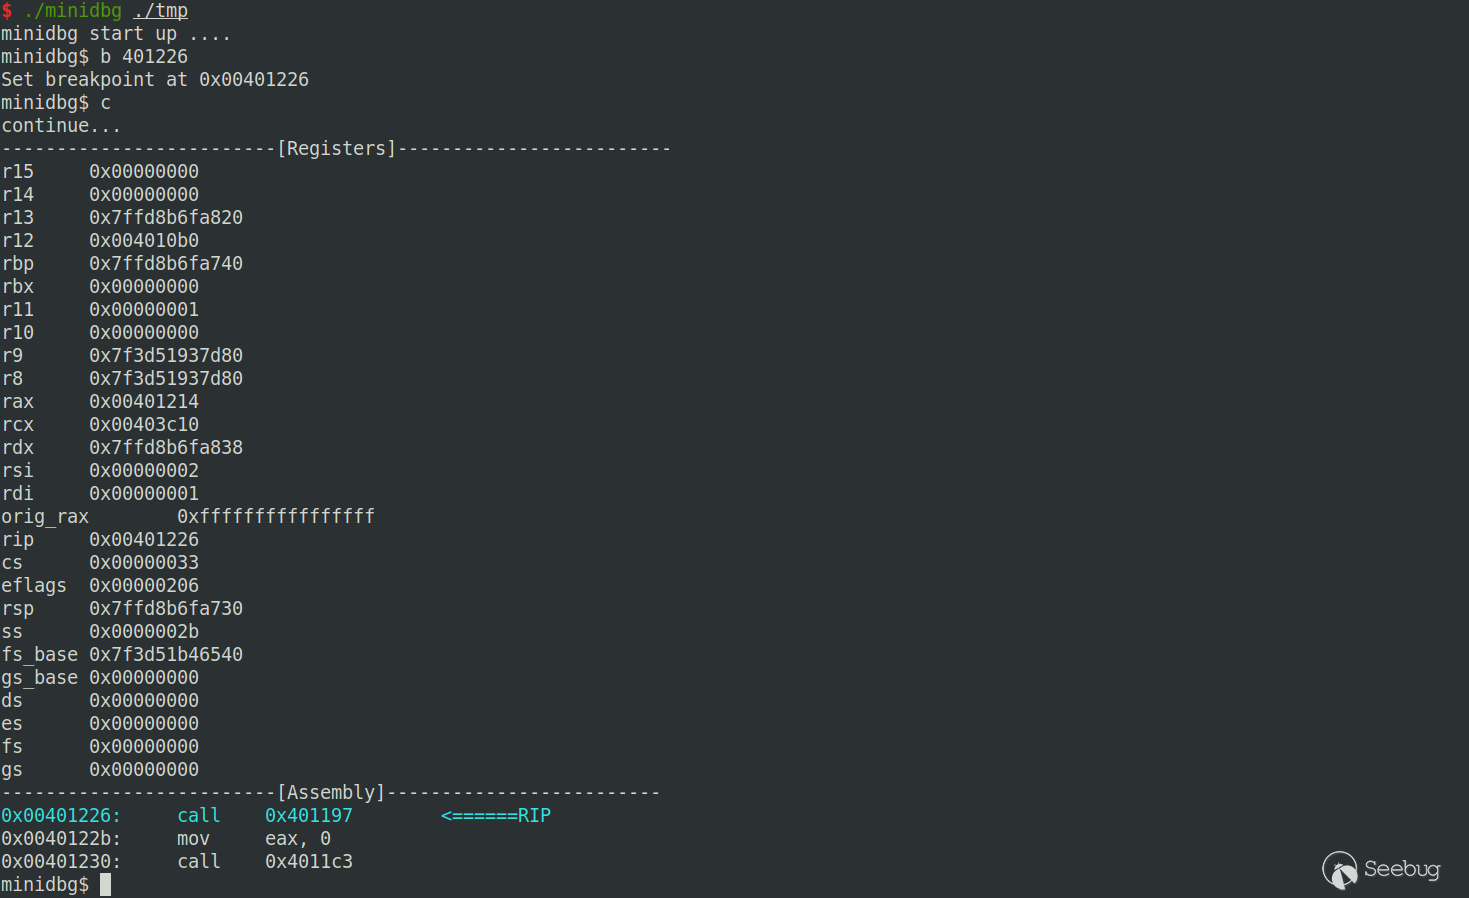
效果
這里還沒有實現多線程/進程調試的功能,源碼,但也算有個調試器的架子了
參考
-
Writing a Linux Debugger Part 1: Setup (tartanllama.xyz):作者講解非常詳細,還涉及源碼調試功能,這里就沒有加入該功能
- squarepants0/minidbg: Writing a minidbg on Linux with C (github.com)
- troydhanson/uthash: C macros for hash tables and more (github.com)
- antirez/linenoise: A small self-contained alternative to readline and libedit (github.com)
 本文由 Seebug Paper 發布,如需轉載請注明來源。本文地址:http://www.bjnorthway.com/2051/