設計自己的Trait編輯器?
在前面的章節中我們知道,每種trait屬性都對應有缺省的trait編輯器,如果在View中不指定編輯器的話,將使用缺省的編輯器構成界面。每個編輯器都可以對應有多個后臺,目前支持的后臺界面庫有pyQt和wxPython。每種編輯器都可以有四種樣式:simple, custom, text, readonly。
traitsUI為我們提供了很豐富的編輯器庫,以至于我們很少有自己設計編輯器的需求,然而如果我們能方便地設計自己的編輯器,將能制作出更加專業的程序界面。
本章節將簡要介紹trait編輯器的工作原理;并且制作一個新的trait編輯器,用以顯示matplotlib提供的繪圖控件;然后以此控件制作一個通用的繪制CSV文件數據圖像的小工具。
Trait編輯器的工作原理?
我們先來看下面這個小程序,它定義了一個TestStrEditor類,其中有一個名為test的trait屬性,其類型為Str,在view中用Item定義要在界面中顯示test屬性,但是沒有指定它所使用的編輯器(通過editor參數)。當執行t.configure_traits()時,traits庫將自動為我們挑選文本編輯框控件作為test屬性的編輯器:
from enthought.traits.api import *
from enthought.traits.ui.api import *

class TestStrEditor(HasTraits):
    test = Str
    view = View(Item("test"))

t = TestStrEditor()
t.configure_traits()
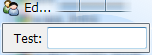
使用文本編輯框控件編輯test屬性
Traits庫的路徑
下面的介紹需要查看traits庫的源程序,因此首先你需要知道它們在哪里:
traits: site-packages\Traits-3.2.0-py2.6-win32.egg\enthought\traits, 以下簡稱 %traits%
traitsUI: site-packages\Traits-3.2.0-py2.6-win32.egg\enthought\traits\UI, 以下簡稱 %ui%
wx后臺界面庫: site-packages\TraitsBackendWX-3.2.0-py2.6.egg\enthought\traitsui\wx, 以下簡稱 %wx%
Str對象的缺省編輯器通過其create_editor方法獲得:
>>> from enthought.traits.api import *
>>> s = Str()
>>> ed = s.create_editor()
>>> type(ed)
<class 'enthought.traits.ui.editors.text_editor.ToolkitEditorFactory'>
>>> ed.get()
{'auto_set': True,
 'custom_editor_class': <class 'enthought.traits.ui.wx.text_editor.CustomEditor'>,
 'enabled': True,
 'enter_set': False,
 'evaluate': <enthought.traits.ui.editors.text_editor._Identity object at 0x0427F1B0>,
 'evaluate_name': '',
 'format_func': None,
 'format_str': '',
 'invalid': '',
 'is_grid_cell': False,
 'mapping': {},
 'multi_line': True,
 'password': False,
 'readonly_editor_class': <class 'enthought.traits.ui.wx.text_editor.ReadonlyEditor'>,
 'simple_editor_class': <class 'enthought.traits.ui.wx.text_editor.SimpleEditor'>,
 'text_editor_class': <class 'enthought.traits.ui.wx.text_editor.SimpleEditor'>,
 'view': None}
create_editor方法的源代碼可以在%traits%trait_types.py中的BaseStr類的定義中找到。create_editor方法得到的是一個text_editor.ToolkitEditorFactory類:
enthought.traits.ui.editors.text_editor.ToolkitEditorFactory
在%ui%editorstext_editor.py中你可以找到它的定義,它繼承于EditorFactory類。EditorFactory類的代碼在%ui%editor_factory.py中。EditorFactory類是Traits編輯器的核心,通過它和后臺界面庫聯系起來。讓我們來詳細看看EditorFactory類中關于控件生成方面的代碼:
class EditorFactory ( HasPrivateTraits ):
    # 下面四個屬性描述四個類型的編輯器的類
    simple_editor_class = Property
    custom_editor_class = Property
    text_editor_class   = Property
    readonly_editor_class = Property

    # 用simple_editor_class創建實際的控件
    def simple_editor ( self, ui, object, name, description, parent ):
        return self.simple_editor_class( parent,
                                         factory     = self,
                                         ui          = ui,
                                         object      = object,
                                         name        = name,
                                         description = description )


    # 這是類的方法,它通過類的以及父類自動找到與其匹配的后臺界面庫中的控件類
    @classmethod
    def _get_toolkit_editor(cls, class_name):
        editor_factory_classes = [factory_class for factory_class in cls.mro()
                                  if issubclass(factory_class, EditorFactory)]
        for index in range(len( editor_factory_classes )):
            try:
                factory_class = editor_factory_classes[index]
                editor_file_name = os.path.basename(
                                sys.modules[factory_class.__module__].__file__)
                return toolkit_object(':'.join([editor_file_name.split('.')[0],
                                             class_name]), True)
            except Exception, e:
                if index == len(editor_factory_classes)-1:
                    raise e
        return None

    # simple_editor_class屬性的get方法,獲取屬性值
    def _get_simple_editor_class(self):
        try:
            SimpleEditor = self._get_toolkit_editor('SimpleEditor')
        except:
            SimpleEditor = toolkit_object('editor_factory:SimpleEditor')
        return SimpleEditor
EditorFactory的對象有四個屬性保存后臺編輯器控件的類:simple_editor_class, custom_editor_class, text_editor_class, readonly_editor_class。例如前面例子中的ed對象的simple_editor_class為<class 'enthought.traits.ui.wx.text_editor.SimpleEditor'>,我們看到它用的是wx后臺界面庫中的text_editor中的SimpleEditor類,稍后我們將看看其內容。
EditorFactory是通過其類方法_get_toolkit_editor計算出所要用后臺界面庫中的類的。由于_get_toolkit_editor是類方法,它的第一個參數cls就是類本身。當調用text_editor.ToolkitEditorFactory._get_toolkit_editor()時,cls就是text_editor.ToolkitEditorFactory類。通過調用cls.mro獲得cls以及其所有父類,然后一個一個地查找,從后臺界面庫中找到與之匹配的類,這個工作由toolkit_object函數完成。其源代碼可以在%ui%toolkit.py中找到。
因為后臺界面庫中的類的組織結構和traits.ui是一樣的,因此不需要額外的配置文件,只需要幾個字符串替代操作就可以將traits.ui中的EditorFactory類和后臺界面庫中的實際的編輯器類聯系起來。下圖顯示了traits.ui中的EditorFactory和后臺界面庫的關系。
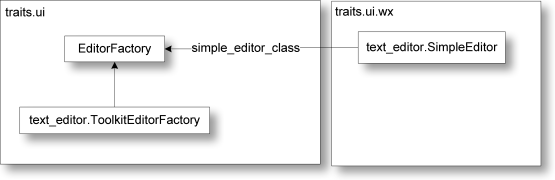
traits.ui中的EditorFactory和后臺界面庫的關系
wx后臺界面庫中定義了所有編輯器控件,在 %wx%text_editor.py 中你可以找到產生文本框控件的類 text_editor.SimpleEditor。類名表示了控件的樣式:simple, custom, text, readonly,而其文件名(模塊名)則表示了控件的類型。下面是 text_editor.SimpleEditor的部分代碼:
class SimpleEditor ( Editor ):

    # Flag for window styles:
    base_style = 0

    # Background color when input is OK:
    ok_color = OKColor

    # Function used to evaluate textual user input:
    evaluate = evaluate_trait

    def init ( self, parent ):
        """ Finishes initializing the editor by creating the underlying toolkit
            widget.
        """
        factory       = self.factory
        style         = self.base_style
        self.evaluate = factory.evaluate
        self.sync_value( factory.evaluate_name, 'evaluate', 'from' )

        if (not factory.multi_line) or factory.password:
            style &= ~wx.TE_MULTILINE

        if factory.password:
            style |= wx.TE_PASSWORD

        multi_line = ((style & wx.TE_MULTILINE) != 0)
        if multi_line:
            self.scrollable = True

        if factory.enter_set and (not multi_line):
            control = wx.TextCtrl( parent, -1, self.str_value,
                                   style = style | wx.TE_PROCESS_ENTER )
            wx.EVT_TEXT_ENTER( parent, control.GetId(), self.update_object )
        else:
            control = wx.TextCtrl( parent, -1, self.str_value, style = style )

        wx.EVT_KILL_FOCUS( control, self.update_object )

        if factory.auto_set:
            wx.EVT_TEXT( parent, control.GetId(), self.update_object )

        self.control = control
        self.set_tooltip()
真正產生控件的程序是在init方法中,此方法在產生界面時自動被調用,注意方法名是init,不要和對象初始化方法__init__搞混淆了。
制作matplotlib的編輯器?
Enthought的官方繪圖庫是采用Chaco,不過如果你對matplotlib庫更加熟悉的話,將matplotlib的繪圖控件嵌入TraitsUI界面中將是非常有用的。下面先來看一下嵌入matplotlib控件的完整源代碼:
# -*- coding: utf-8 -*-
# file name: mpl_figure_editor.py
import wx
import matplotlib
# matplotlib采用WXAgg為后臺,這樣才能將繪圖控件嵌入以wx為后臺界面庫的traitsUI窗口中
matplotlib.use("WXAgg")
from matplotlib.backends.backend_wxagg import FigureCanvasWxAgg as FigureCanvas
from matplotlib.backends.backend_wx import NavigationToolbar2Wx
from enthought.traits.ui.wx.editor import Editor
from enthought.traits.ui.basic_editor_factory import BasicEditorFactory

class _MPLFigureEditor(Editor):
    """
    相當于wx后臺界面庫中的編輯器,它負責創建真正的控件
    """
    scrollable = True

    def init(self, parent):
        self.control = self._create_canvas(parent)
        self.set_tooltip()
        print dir(self.item)

    def update_editor(self):
        pass

    def _create_canvas(self, parent):
        """
        創建一個Panel, 布局采用垂直排列的BoxSizer, panel中中添加
        FigureCanvas, NavigationToolbar2Wx, StaticText三個控件
        FigureCanvas的鼠標移動事件調用mousemoved函數,在StaticText
        顯示鼠標所在的數據坐標
        """
        panel = wx.Panel(parent, -1, style=wx.CLIP_CHILDREN)
        def mousemoved(event):
            panel.info.SetLabel("%s, %s" % (event.xdata, event.ydata))
        panel.mousemoved = mousemoved
        sizer = wx.BoxSizer(wx.VERTICAL)
        panel.SetSizer(sizer)
        mpl_control = FigureCanvas(panel, -1, self.value)
        mpl_control.mpl_connect("motion_notify_event", mousemoved)
        toolbar = NavigationToolbar2Wx(mpl_control)
        sizer.Add(mpl_control, 1, wx.LEFT | wx.TOP | wx.GROW)
        sizer.Add(toolbar, 0, wx.EXPAND|wx.RIGHT)
        panel.info = wx.StaticText(parent, -1)
        sizer.Add(panel.info)

        self.value.canvas.SetMinSize((10,10))
        return panel

class MPLFigureEditor(BasicEditorFactory):
    """
    相當于traits.ui中的EditorFactory,它返回真正創建控件的類
    """
    klass = _MPLFigureEditor

if __name__ == "__main__":
    from matplotlib.figure import Figure
    from enthought.traits.api import HasTraits, Instance
    from enthought.traits.ui.api import View, Item
    from numpy import sin, cos, linspace, pi

    class Test(HasTraits):
        figure = Instance(Figure, ())
        view = View(
            Item("figure", editor=MPLFigureEditor(), show_label=False),
            width = 400,
            height = 300,
            resizable = True)
        def __init__(self):
            super(Test, self).__init__()
            axes = self.figure.add_subplot(111)
            t = linspace(0, 2*pi, 200)
            axes.plot(sin(t))

    Test().configure_traits()
此程序的運行結果如下:
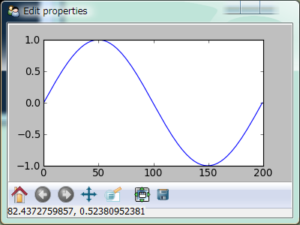
在TraitsUI界面中嵌入的matplotlib繪圖控件
由于我們的編輯器沒有simple等四種樣式,也不會放到wx后臺界面庫的模塊中,因此不能采用上節所介紹的自動查找編輯器類的辦法。traits.ui為我們提供一個一個方便的類來完成這些操作:BasicEditorFactory。它的源程序可以在 %ui%basic_editor_factory.py中找到。下面是其中的一部分:
class BasicEditorFactory ( EditorFactory ):
    klass = Any

    def _get_simple_editor_class ( self ):
        return self.klass
    ...
它通過重載EditorFactory中的simple_editor_class屬性,直接返回創建控件的庫klass。MPLFigureEditor繼承于BasicEditorFactory,指定創建控件的類為_MPLFigureEditor。
和text_editor.SimpleEditor一樣,從Editor類繼承,在_MPLFigureEditor類的init方法中,創建實際的控件。因為Editor類中有一個update_editor方法,在其對應的trait屬性改變是會被調用,而我們的繪圖控件不需要這個功能,所以重載update_editor,讓它不做任何事情。
matplotlib中,在創建FigureCanvas時需要指定與其對應的Figure對象:
mpl_control = FigureCanvas(panel, -1, self.value)
這里self.value就是這個Figure對象,它在MVC的模型類Test中被定義為:
figure = Instance(Figure, ())
控件類可以通過self.value獲得與其對應的模型類中的對象。因此_MPLFigureEditor中的self.value和Test類中的self.figure是同一個對象。
_create_canvas方法中的程序編寫和在一個標準的wx窗口中添加控件是一樣的,界面庫相關的細節不是本書的重點,因此不再詳細解釋了。讀者可以參照matplotlib和wxPython的相應文檔。
CSV數據繪圖工具?
下面用前面介紹的matplotlib編輯器制作一個CSV數據繪圖工具。用此工具打開一個CSV數據文檔之后,可以繪制多個X-Y坐標圖。用戶可以自由地添加新的坐標圖,修改坐標圖的標題,選擇坐標圖的X軸和Y軸的數據。
下面是此程序的界面截圖:
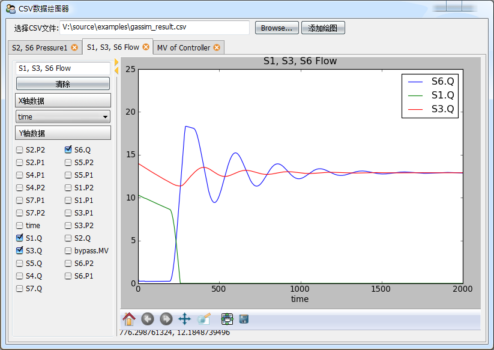
CSV數據繪圖工具的界面
圖中以標簽頁的形式顯示多個繪圖,用戶可以從左側的數據選擇欄中選擇X軸和Y軸的數據。標簽頁可以自由的拖動,構成上下左右分欄,并且可以隱藏左側的數據選擇欄:
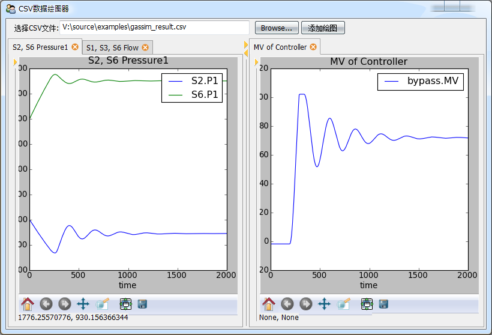
使用可調整DOCK的多標簽頁界面方便用戶對比數據
由于繪圖控件是matplotlib所提供的,因此平移、縮放、保存文件等功能也一應俱全。由于所有的界面都是采用TraitsUI設計的,因此主窗口既可以用來單獨顯示,也可以嵌入到一個更大的界面中,運用十分靈活。
下面是完整的源程序,運行時需要和mpl_figure_editor.py放在一個文件夾下。包括注釋程序一共約170行,編寫時間少于一小時。
1 2 3 4 5 6 7 8 9 10 11 12 13 14 15 16 17 18 19 20 21 22 23 24 25 26 27 28 29 30 31 32 33 34 35 36 37 38 39 40 41 42 43 44 45 46 47 48 49 50 51 52 53 54 55 56 57 58 59 60 61 62 63 64 65 66 67 68 69 70 71 72 73 74 75 76 77 78 79 80 81 82 83 84 85 86 87 88 89 90 91 92 93 94 95 96 97 98 99 100 101 102 103 104 105 106 107 108 109 110 111 112 113 114 115 116 117 118 119 120 121 122 123 124 125 126 127 128 129 130 131 132 133 134 135 136 137 138 139 140 141 142 143 144 145 146 147 148 149 150 151 152 153 154 155 156 157 158 159 160 161 162 163 164 165 166 167 168 169 170 171 | # -*- coding: utf-8 -*-
from matplotlib.figure import Figure
from mpl_figure_editor import MPLFigureEditor
from enthought.traits.ui.api import *
from enthought.traits.api import *
import csv
class DataSource(HasTraits):
"""
數據源,data是一個字典,將字符串映射到列表
names是data中的所有字符串的列表
"""
data = DictStrAny
names = List(Str)
def load_csv(self, filename):
"""
從CSV文件讀入數據,更新data和names屬性
"""
f = file(filename)
reader = csv.DictReader(f)
self.names = reader.fieldnames
for field in reader.fieldnames:
self.data[field] = []
for line in reader:
for k, v in line.iteritems():
self.data[k].append(float(v))
f.close()
class Graph(HasTraits):
"""
繪圖組件,包括左邊的數據選擇控件和右邊的繪圖控件
"""
name = Str # 繪圖名,顯示在標簽頁標題和繪圖標題中
data_source = Instance(DataSource) # 保存數據的數據源
figure = Instance(Figure) # 控制繪圖控件的Figure對象
selected_xaxis = Str # X軸所用的數據名
selected_items = List # Y軸所用的數據列表
clear_button = Button(u"清除") # 快速清除Y軸的所有選擇的數據
view = View(
HSplit( # HSplit分為左右兩個區域,中間有可調節寬度比例的調節手柄
# 左邊為一個組
VGroup(
Item("name"), # 繪圖名編輯框
Item("clear_button"), # 清除按鈕
Heading(u"X軸數據"), # 靜態文本
# X軸選擇器,用EnumEditor編輯器,即ComboBox控件,控件中的候選數據從
# data_source的names屬性得到
Item("selected_xaxis", editor=
EnumEditor(name="object.data_source.names", format_str=u"%s")),
Heading(u"Y軸數據"), # 靜態文本
# Y軸選擇器,由于Y軸可以多選,因此用CheckBox列表編輯,按兩列顯示
Item("selected_items", style="custom",
editor=CheckListEditor(name="object.data_source.names",
cols=2, format_str=u"%s")),
show_border = True, # 顯示組的邊框
scrollable = True, # 組中的控件過多時,采用滾動條
show_labels = False # 組中的所有控件都不顯示標簽
),
# 右邊繪圖控件
Item("figure", editor=MPLFigureEditor(), show_label=False, width=600)
)
)
def _name_changed(self):
"""
當繪圖名發生變化時,更新繪圖的標題
"""
axe = self.figure.axes[0]
axe.set_title(self.name)
self.figure.canvas.draw()
def _clear_button_fired(self):
"""
清除按鈕的事件處理
"""
self.selected_items = []
self.update()
def _figure_default(self):
"""
figure屬性的缺省值,直接創建一個Figure對象
"""
figure = Figure()
figure.add_axes([0.05, 0.1, 0.9, 0.85]) #添加繪圖區域,四周留有邊距
return figure
def _selected_items_changed(self):
"""
Y軸數據選擇更新
"""
self.update()
def _selected_xaxis_changed(self):
"""
X軸數據選擇更新
"""
self.update()
def update(self):
"""
重新繪制所有的曲線
"""
axe = self.figure.axes[0]
axe.clear()
try:
xdata = self.data_source.data[self.selected_xaxis]
except:
return
for field in self.selected_items:
axe.plot(xdata, self.data_source.data[field], label=field)
axe.set_xlabel(self.selected_xaxis)
axe.set_title(self.name)
axe.legend()
self.figure.canvas.draw()
class CSVGrapher(HasTraits):
"""
主界面包括繪圖列表,數據源,文件選擇器和添加繪圖按鈕
"""
graph_list = List(Instance(Graph)) # 繪圖列表
data_source = Instance(DataSource) # 數據源
csv_file_name = File(filter=[u"*.csv"]) # 文件選擇
add_graph_button = Button(u"添加繪圖") # 添加繪圖按鈕
view = View(
# 整個窗口分為上下兩個部分
VGroup(
# 上部分橫向放置控件,因此用HGroup
HGroup(
# 文件選擇控件
Item("csv_file_name", label=u"選擇CSV文件", width=400),
# 添加繪圖按鈕
Item("add_graph_button", show_label=False)
),
# 下部分是繪圖列表,采用ListEditor編輯器顯示
Item("graph_list", style="custom", show_label=False,
editor=ListEditor(
use_notebook=True, # 是用多標簽頁格式顯示
deletable=True, # 可以刪除標簽頁
dock_style="tab", # 標簽dock樣式
page_name=".name") # 標題頁的文本使用Graph對象的name屬性
)
),
resizable = True,
height = 0.8,
width = 0.8,
title = u"CSV數據繪圖器"
)
def _csv_file_name_changed(self):
"""
打開新文件時的處理,根據文件創建一個DataSource
"""
self.data_source = DataSource()
self.data_source.load_csv(self.csv_file_name)
del self.graph_list[:]
def _add_graph_button_changed(self):
"""
添加繪圖按鈕的事件處理
"""
if self.data_source != None:
self.graph_list.append( Graph(data_source = self.data_source) )
if __name__ == "__main__":
csv_grapher = CSVGrapher()
csv_grapher.configure_traits()
|
程序中已經有比較詳細的注釋,這里就不再重復。如果你對traits庫的某項用法還不太了解的話,可以直接查看其源代碼,代碼中都有詳細的注釋。下面是幾個比較重點的部分:
整個程序的界面處理都只是組裝View對象,看不到任何關于控件操作的代碼,因此大大地節省了程序的開發時間。
通過配置141行的ListEditor,使其用標簽頁的方式顯示graph_list中的每個元素,以此管理多個Graph對象。
在43行中,Graph類用HSplit將其數據選擇部分和繪圖控件部分分開,HSplit提供的更改左右部分的比例和隱藏的功能。
本書寫作時所采用的traitsUI庫版本為3.2,如果在標簽頁標題中輸入中文,會出現錯誤,這是因為TraitsUI中還有些代碼對unicode的支持不夠,希望日后會有所改善。目前可以通過分析錯誤提示信息,修改TraitsUI庫的源代碼,只需要將下面提示中的770行中的str改為unicode既可以修復。
File "C:\Python26\lib\site-packages\traitsbackendwx-3.2.0-py2.6.egg\enthought\
traits\ui\wx\list_editor.py", line 770, in _create_page
name = str( name ) or '???'
UnicodeEncodeError: 'ascii' codec can't encode characters in position 0-1:
ordinal not in range(128)
matplotlib的繪圖中是可以使用中文的,但是由于缺省字體不是中文字體,因此中文都變為方塊,你可以按照 讓Matplotlib顯示中文 中所述修改matplotlib的字體。